Everything You Need to Monitor What Matters
Uptime checks, custom metrics, SSL monitoring, status pages, AI setup, templates, and a native iOS app. Every feature is available to every user.
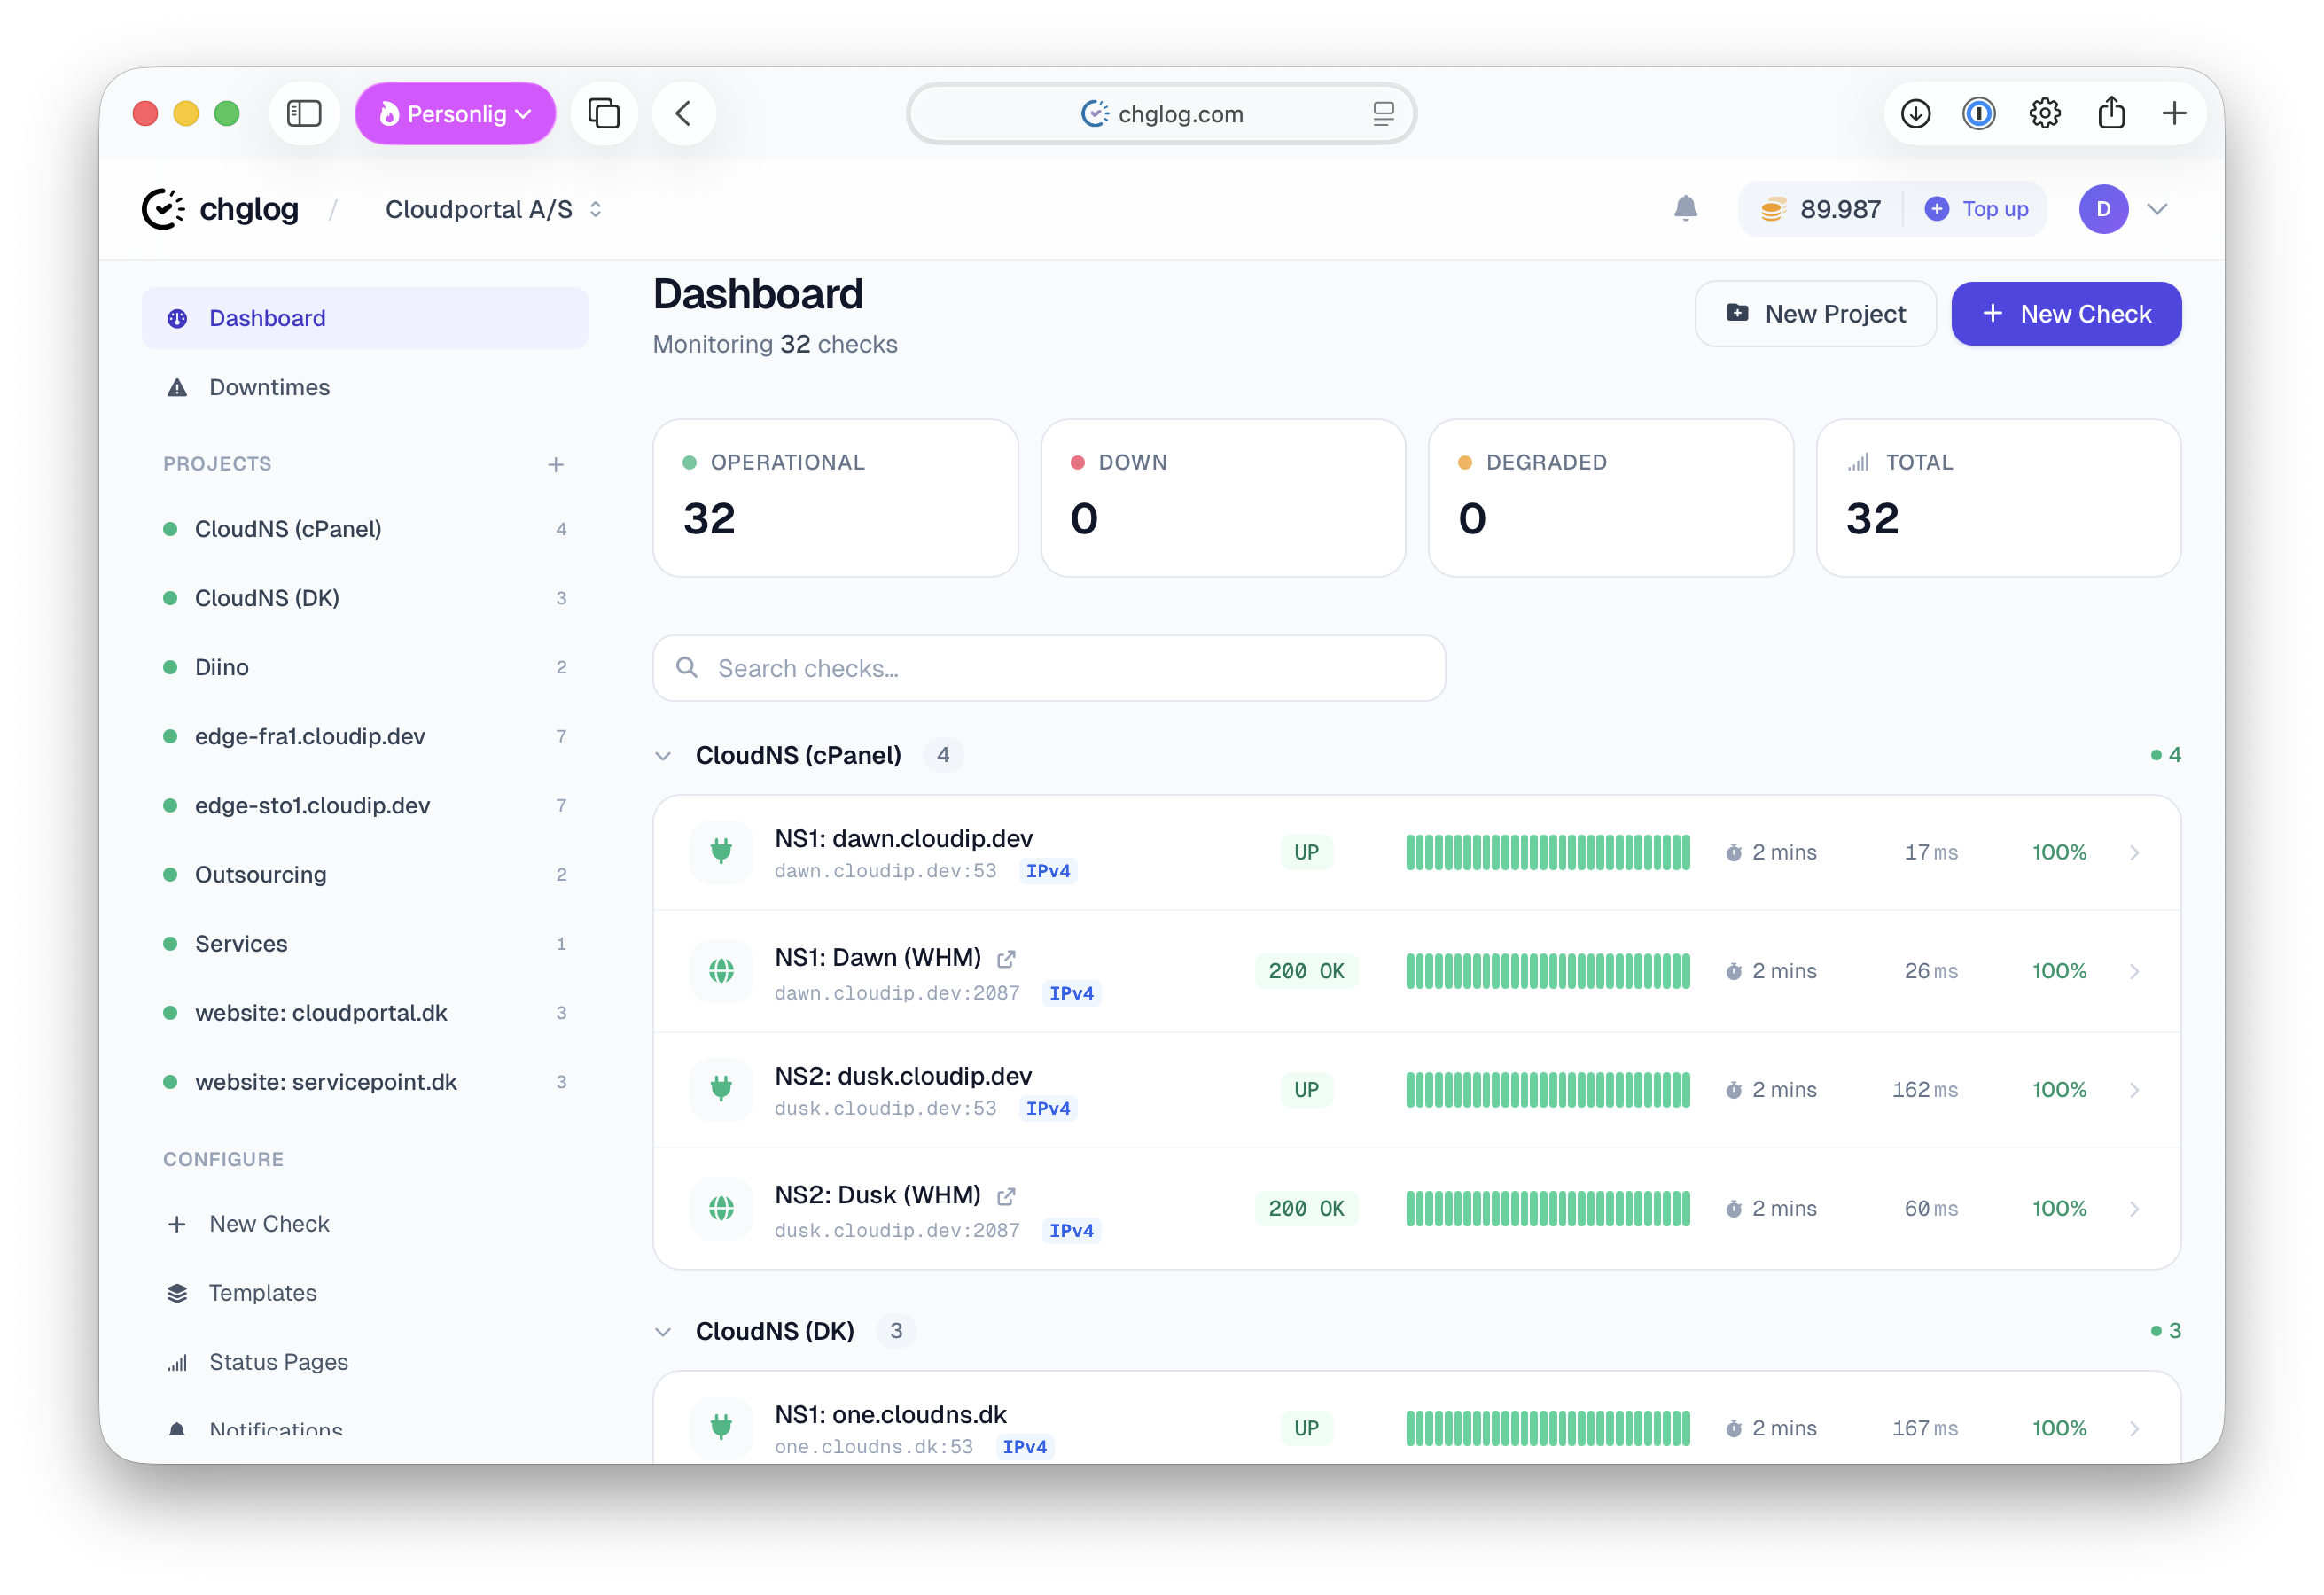
Start Free — 100,000 CreditsUptime Monitoring That Actually Works
HTTP, keyword matching, and string-based checks from multiple global locations. Every alert is double-checked from a second node to eliminate false positives — so you only hear from us when it really matters.
- HTTP & keyword checks — Verify status codes, response content, and page elements
- Double-check from multiple geographical locations — No false alarms from network blips
- 30s to 1h intervals — Choose the frequency that fits your needs
- Response time tracking — Full timing breakdown with DNS, connect, TLS, TTFB and transfer metrics
- Uptime history & reporting — 24h uptime bars, percentage tracking, and detailed event logs
- Custom headers & auth — Monitor authenticated endpoints with custom request headers
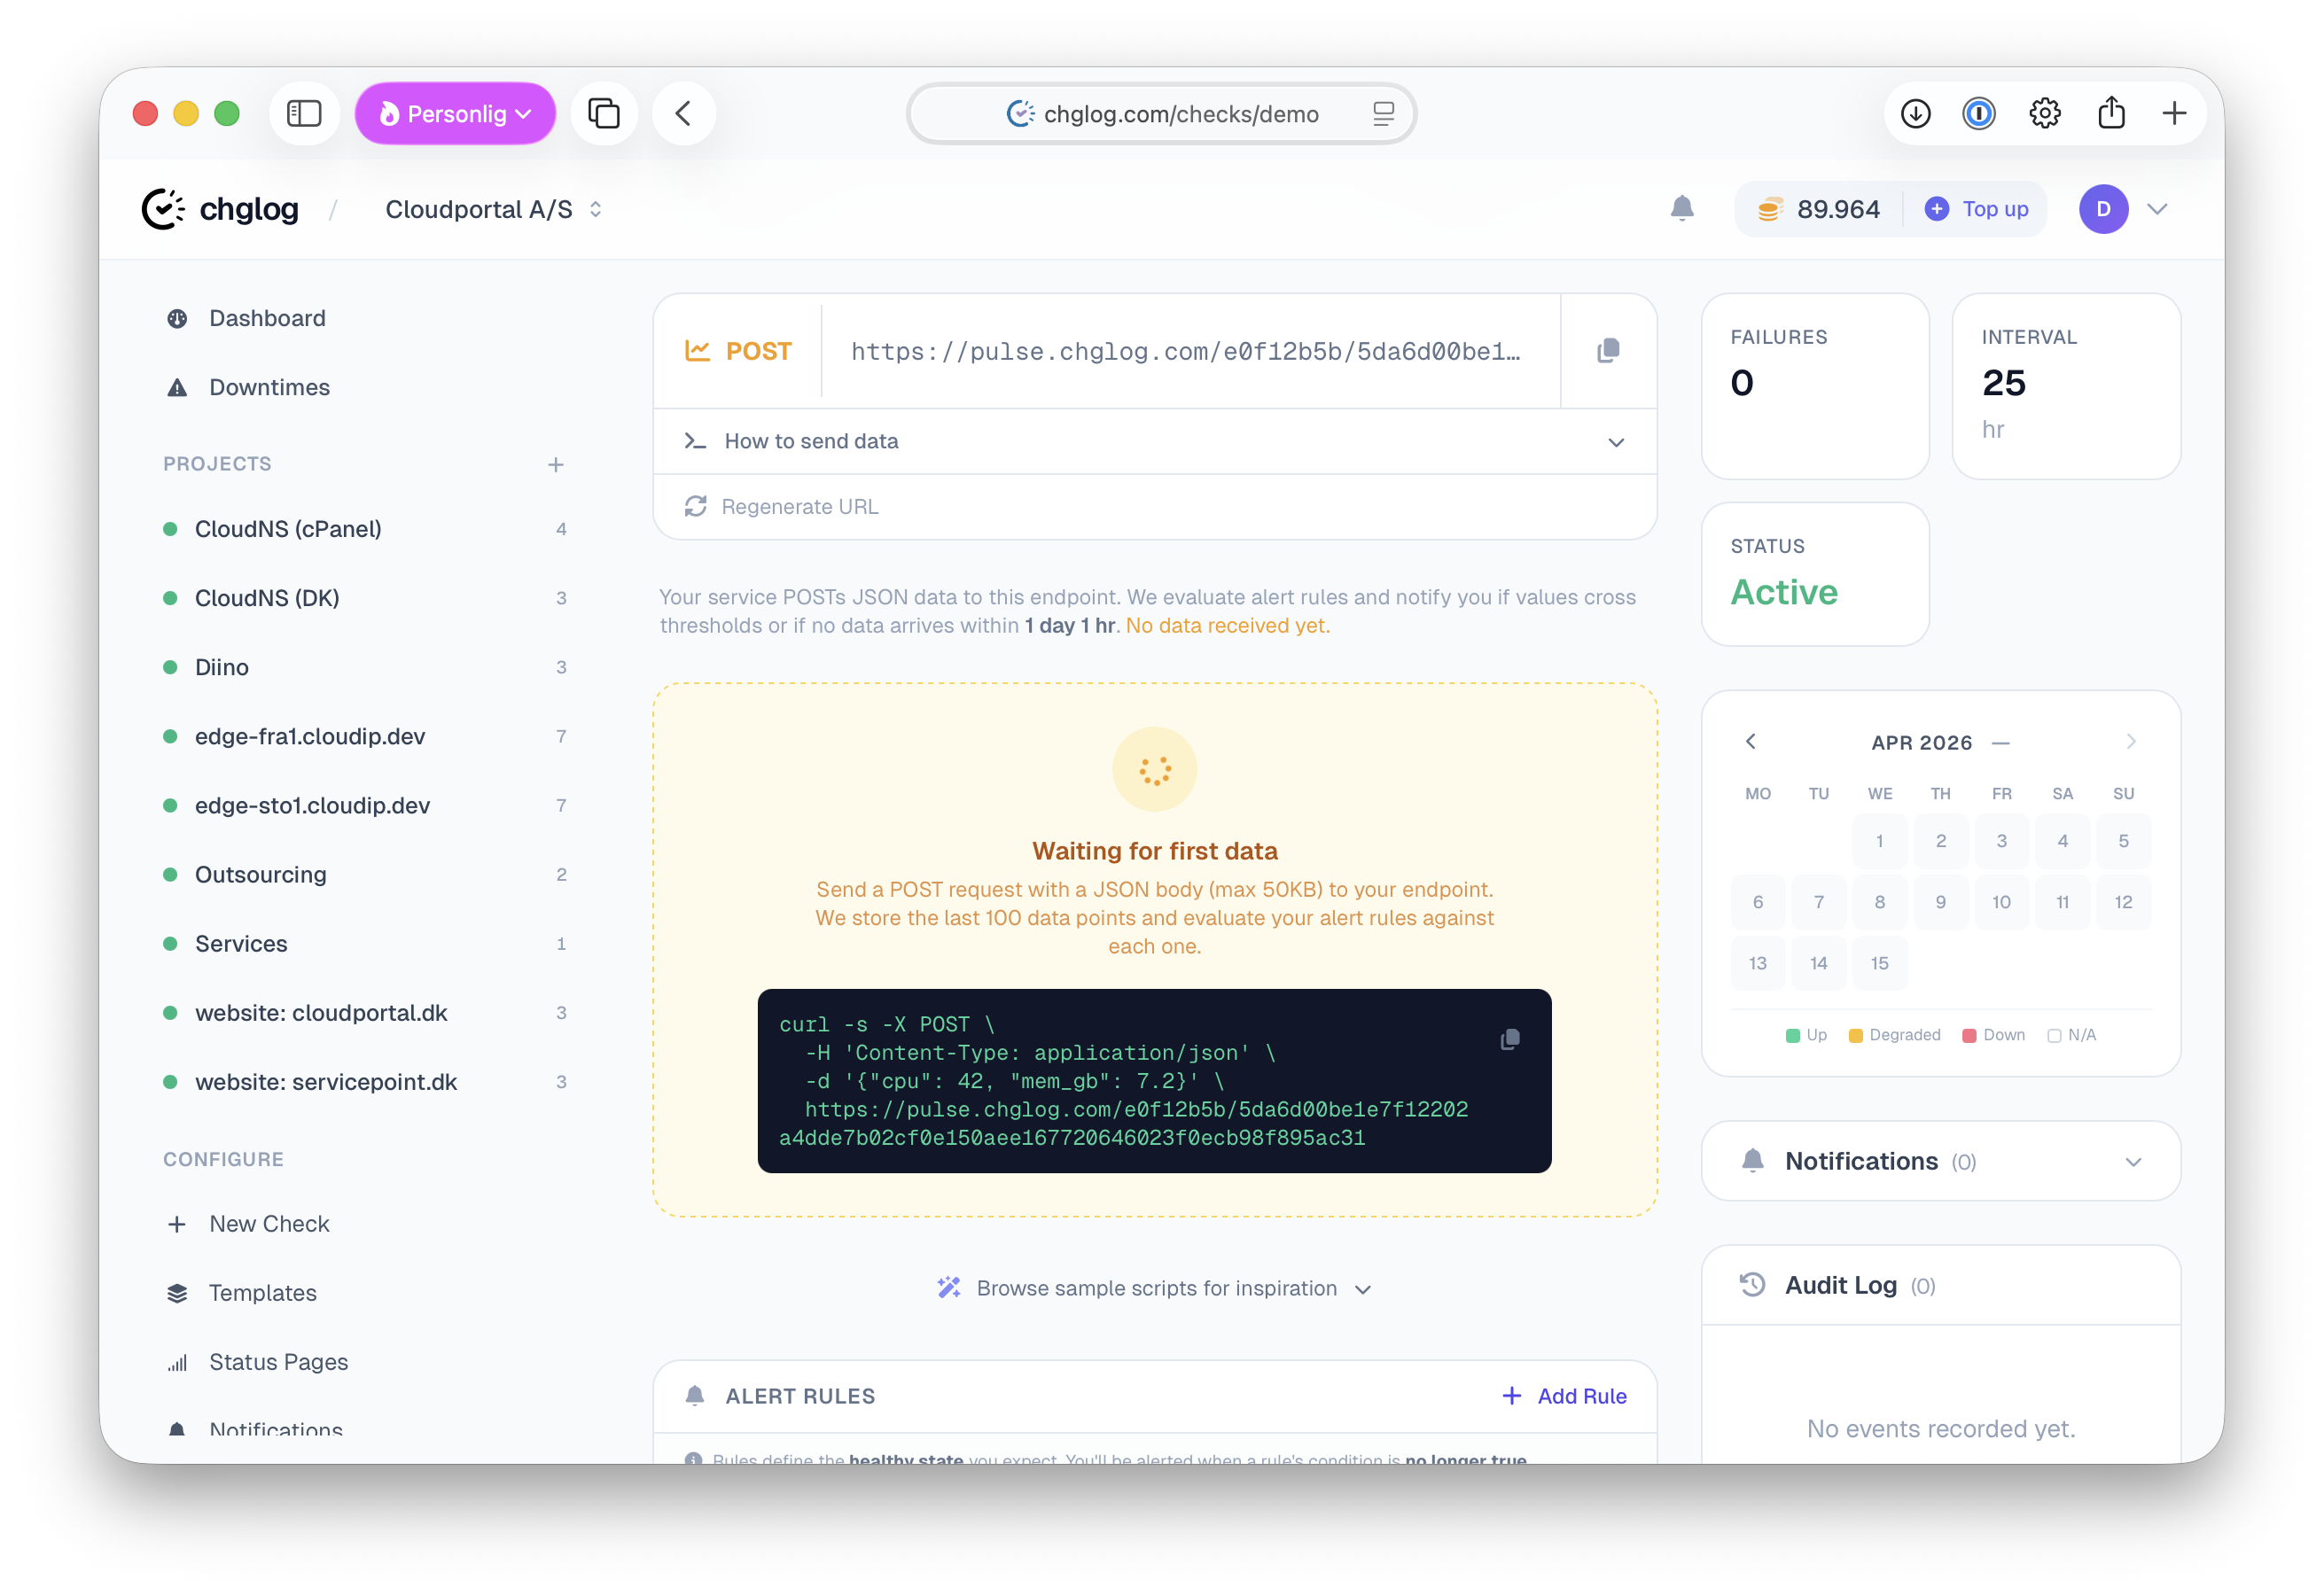
Pulse+Data: Monitor Anything
Go beyond websites. Push any metric from your infrastructure via a simple HTTP request and get alerted when thresholds are crossed. Monitor what no other tool can — from signup flows to Docker container health.
- Signup flow tests — Verify your registration process end-to-end
- API health & response data — Track JSON responses, status codes, latency
- Server metrics — Disk space, memory, CPU, Docker container health
- Custom thresholds & rules — Define min/max ranges, rate-of-change alerts
- Multi-field data points — Push multiple metrics in a single request
- Historical graphs — Visualize trends over time with built-in charts
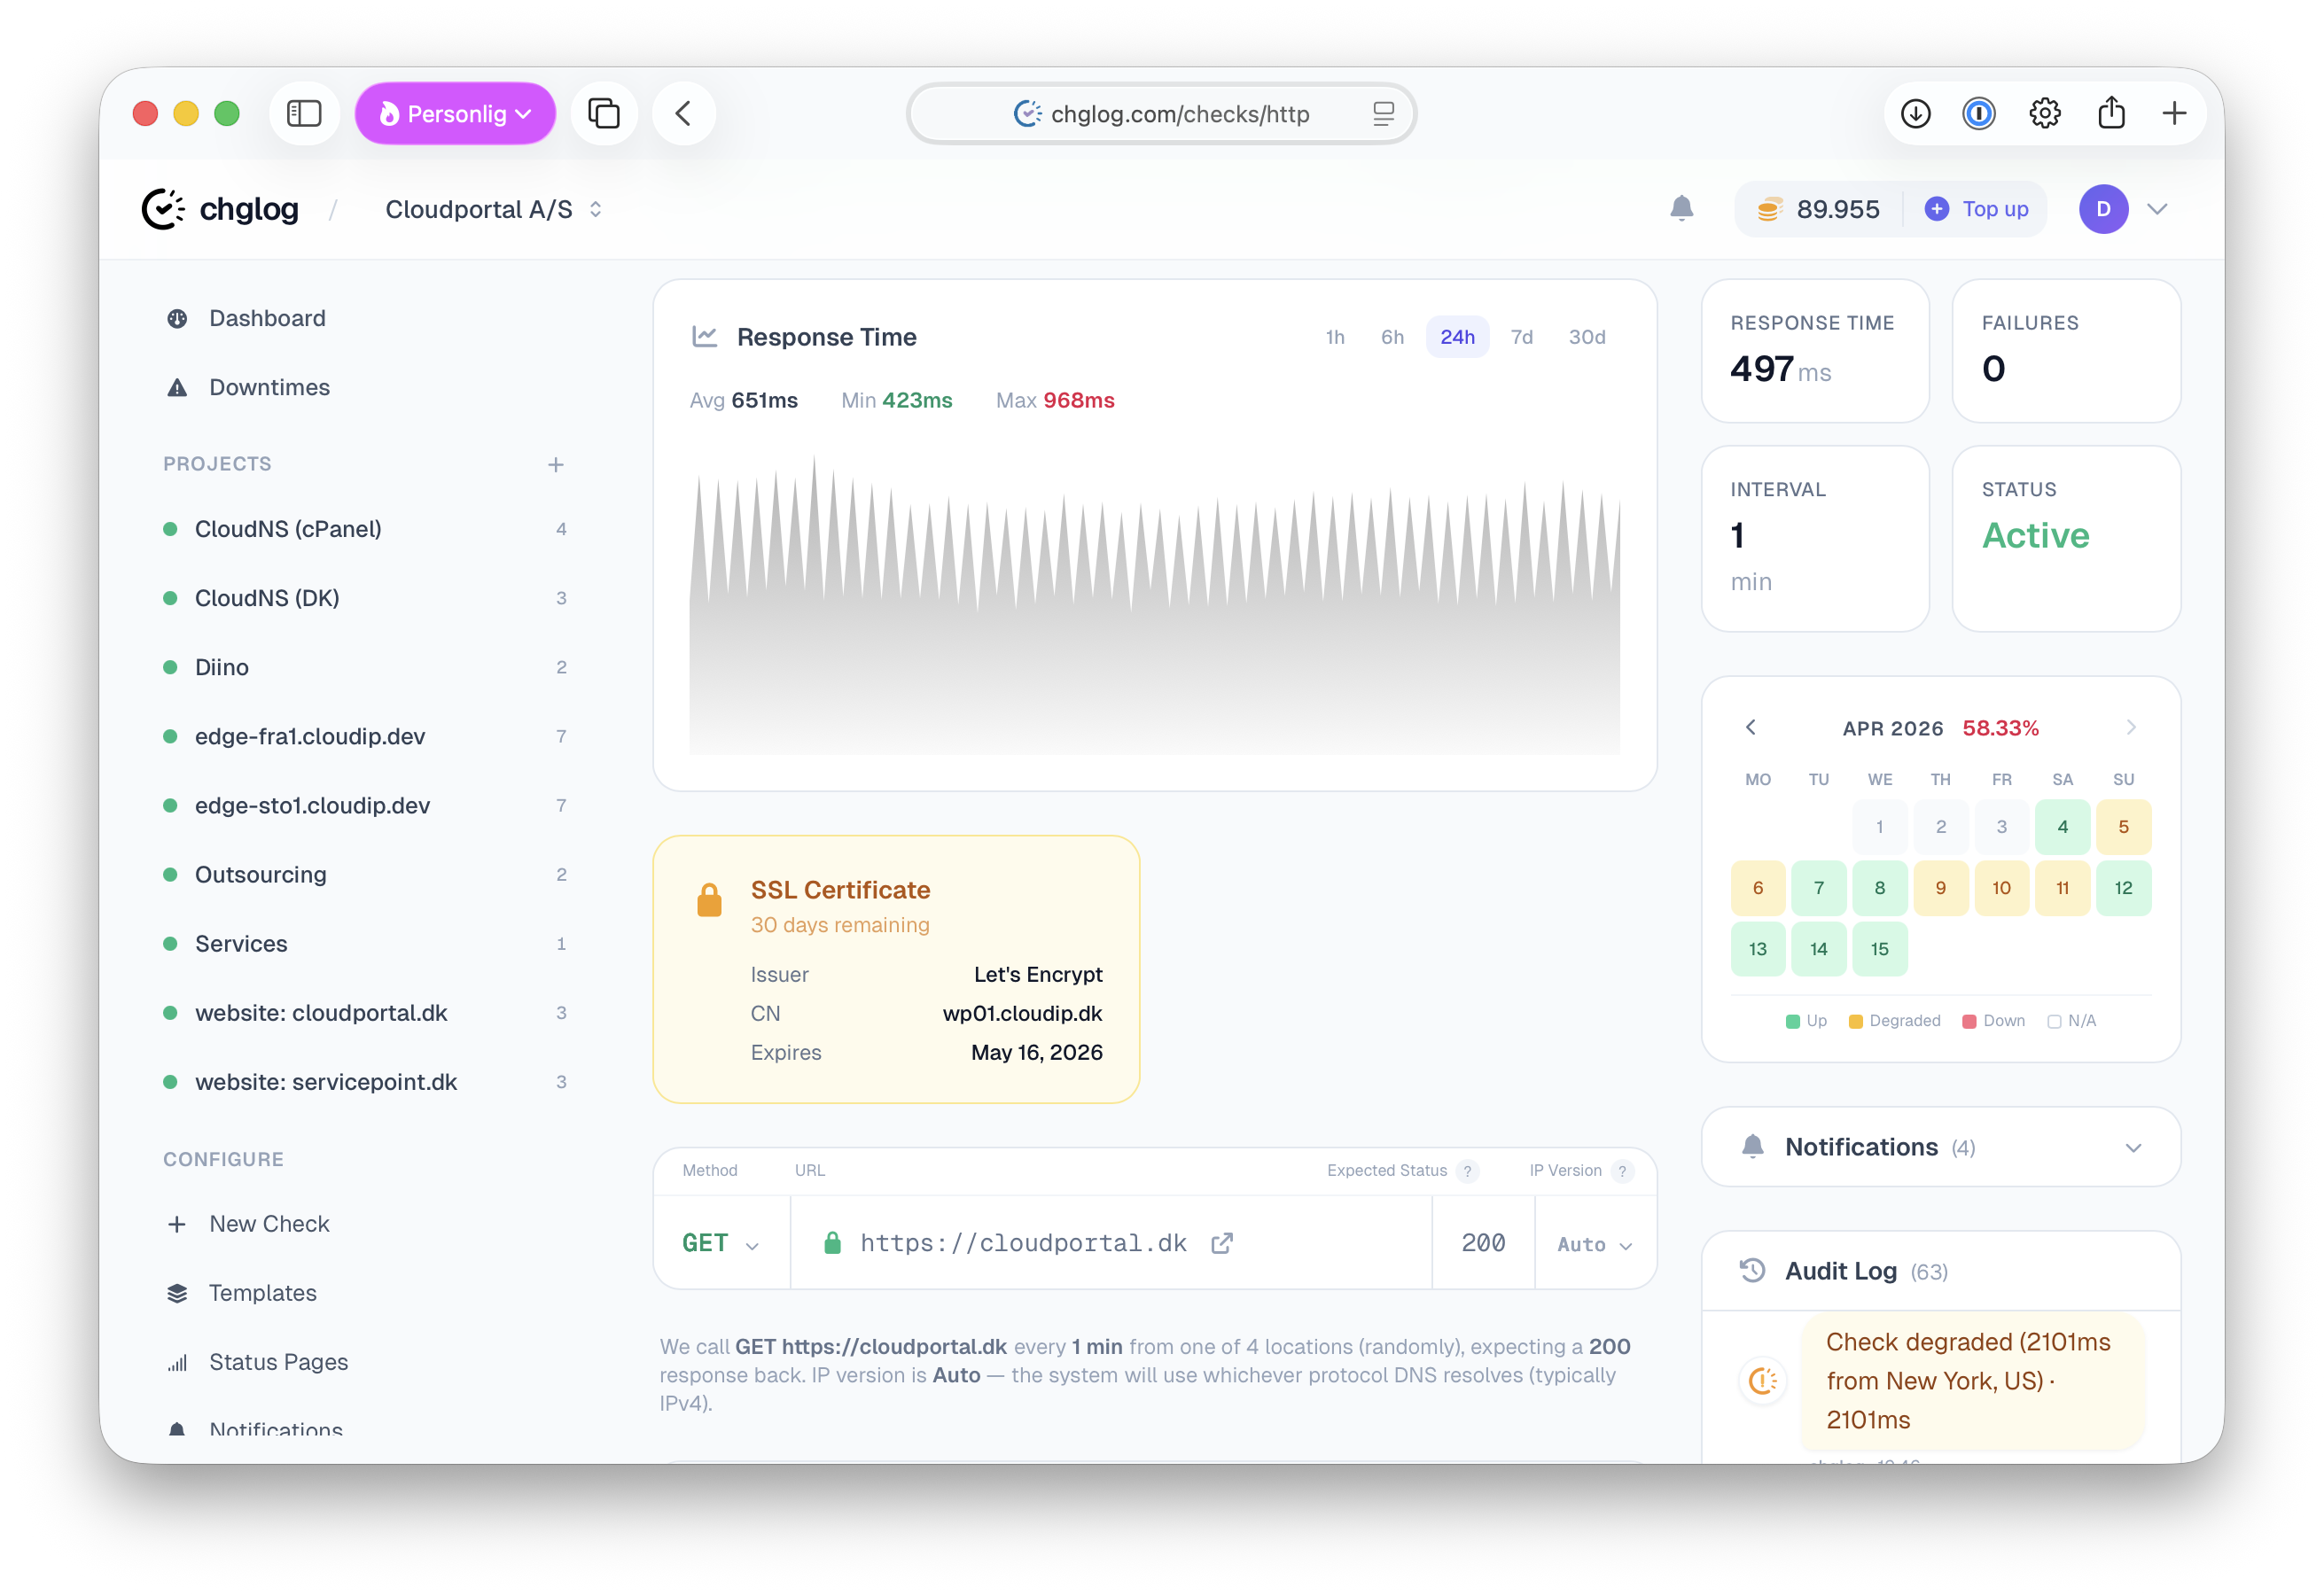
SSL & Domain Monitoring — Free
Every HTTPS check automatically monitors your SSL certificate and WHOIS domain data. No extra setup, no extra cost. Most competitors charge extra for these features — we include them with every check.
- SSL expiration alerts — Get notified 30, 14, 7 and 1 day before expiry
- Certificate change detection — Know when your SSL cert changes issuer or key
- WHOIS monitoring — Domain expiry, registrar changes, DNS snapshots
- DNS change tracking — See exactly when A, AAAA, MX or CNAME records change
- Certificate chain validation — Full chain verification including intermediates
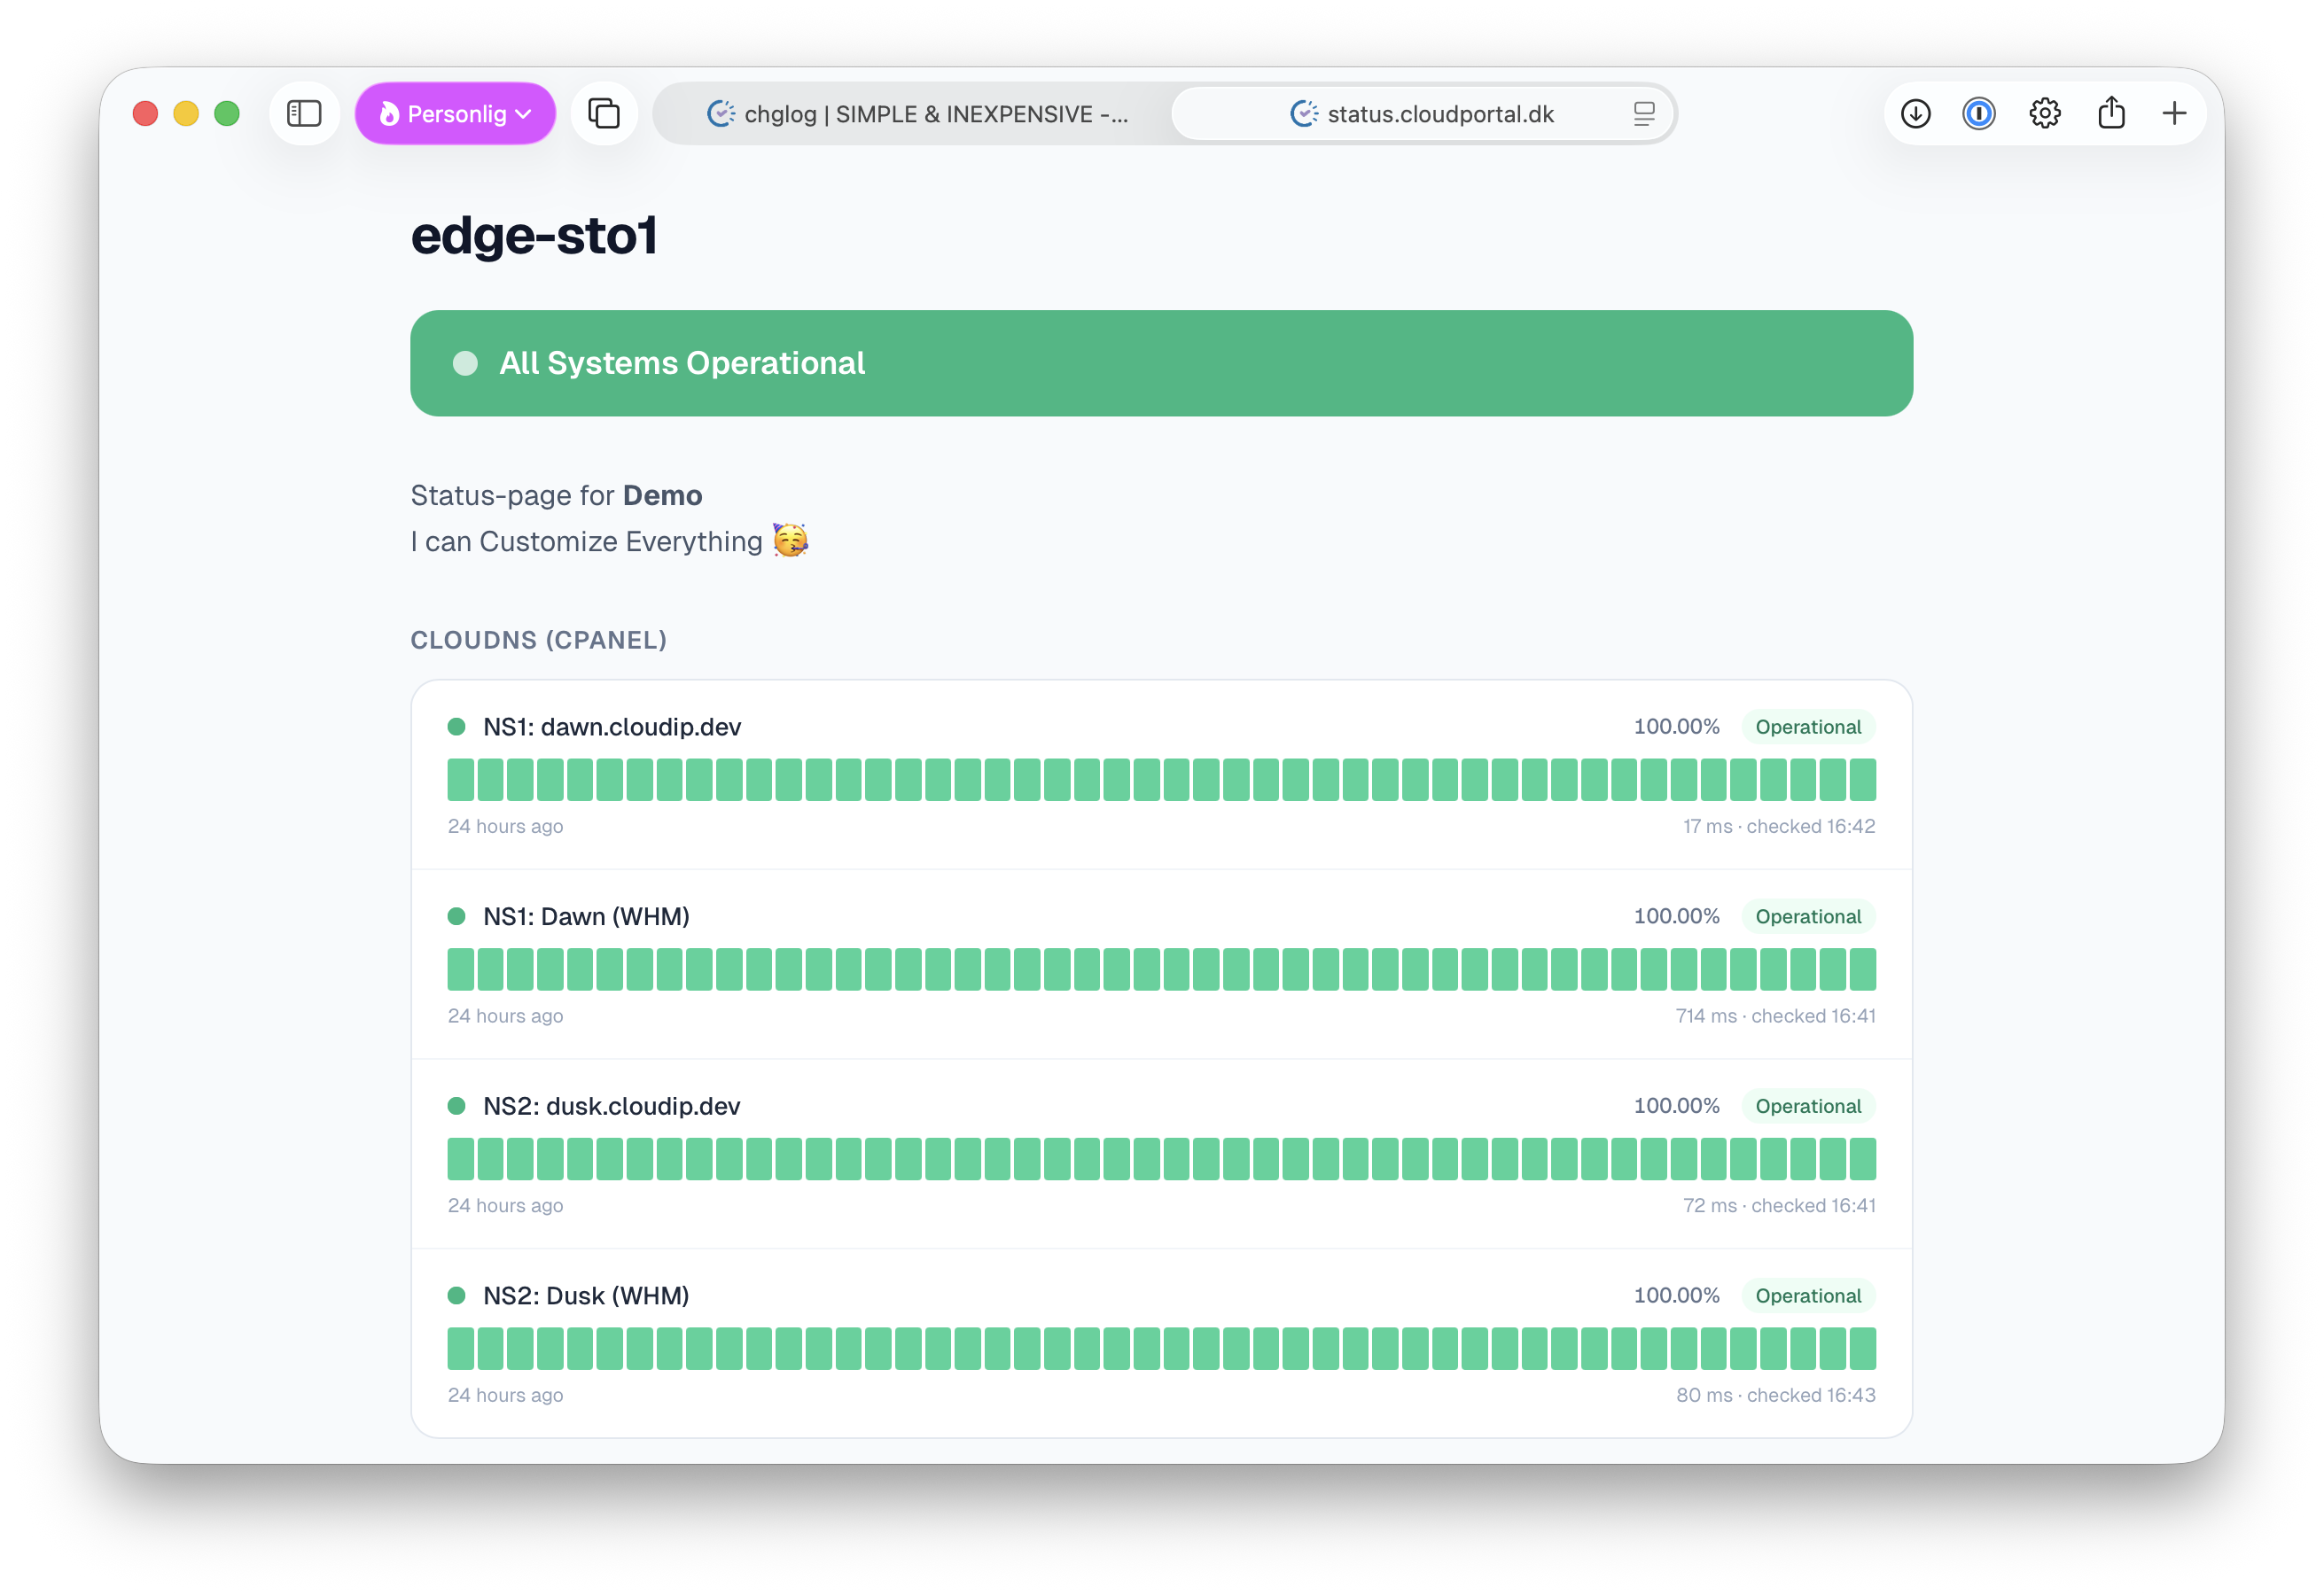
Status Pages with Incident Blog
Give your users transparency. Create branded public status pages with real-time component status, incident timelines, and post-mortem blog posts. Your customers stay informed automatically.
- Custom domain & branding — Your logo, colors, and domain name
- Incident management — Create, update, and resolve incidents with timeline
- Post-mortem blog — Publish detailed write-ups for your customers
- Component grouping — Organize services into logical groups
- Real-time updates — Status changes reflect instantly on the public page
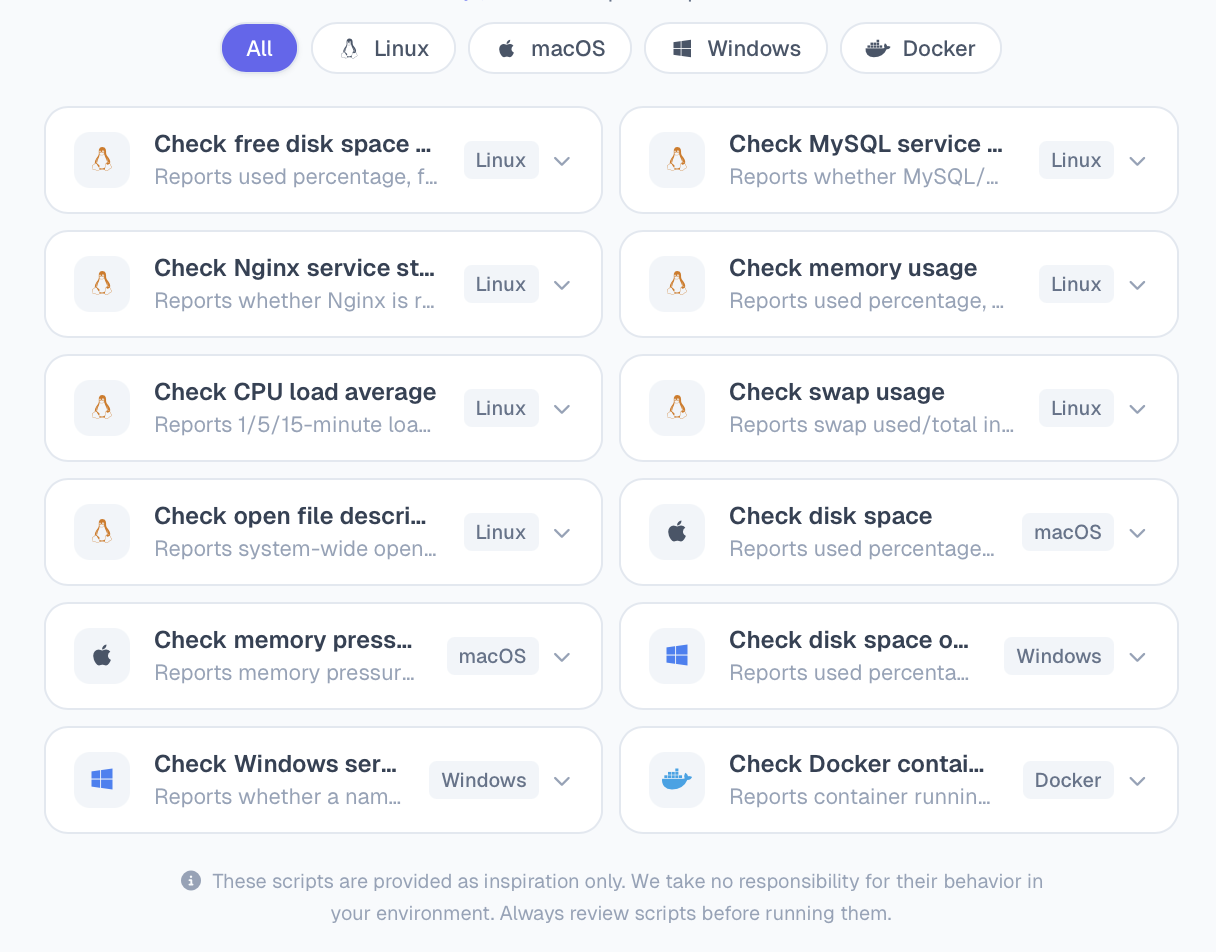
AI That Sets Up Your Monitoring
Describe what you want to monitor in plain language — "Monitor my checkout API and alert me if response time exceeds 2 seconds." Our AI generates integration code, rules, and thresholds. Copy, deploy, and you're monitoring in minutes.
- Natural language setup — "Monitor my signup API response time"
- Auto-generated code — Ready-to-use integration snippets in your language
- Smart rule suggestions — AI recommends alert thresholds based on your data
- Pulse+Data scripts — Generate complete monitoring scripts for any use case
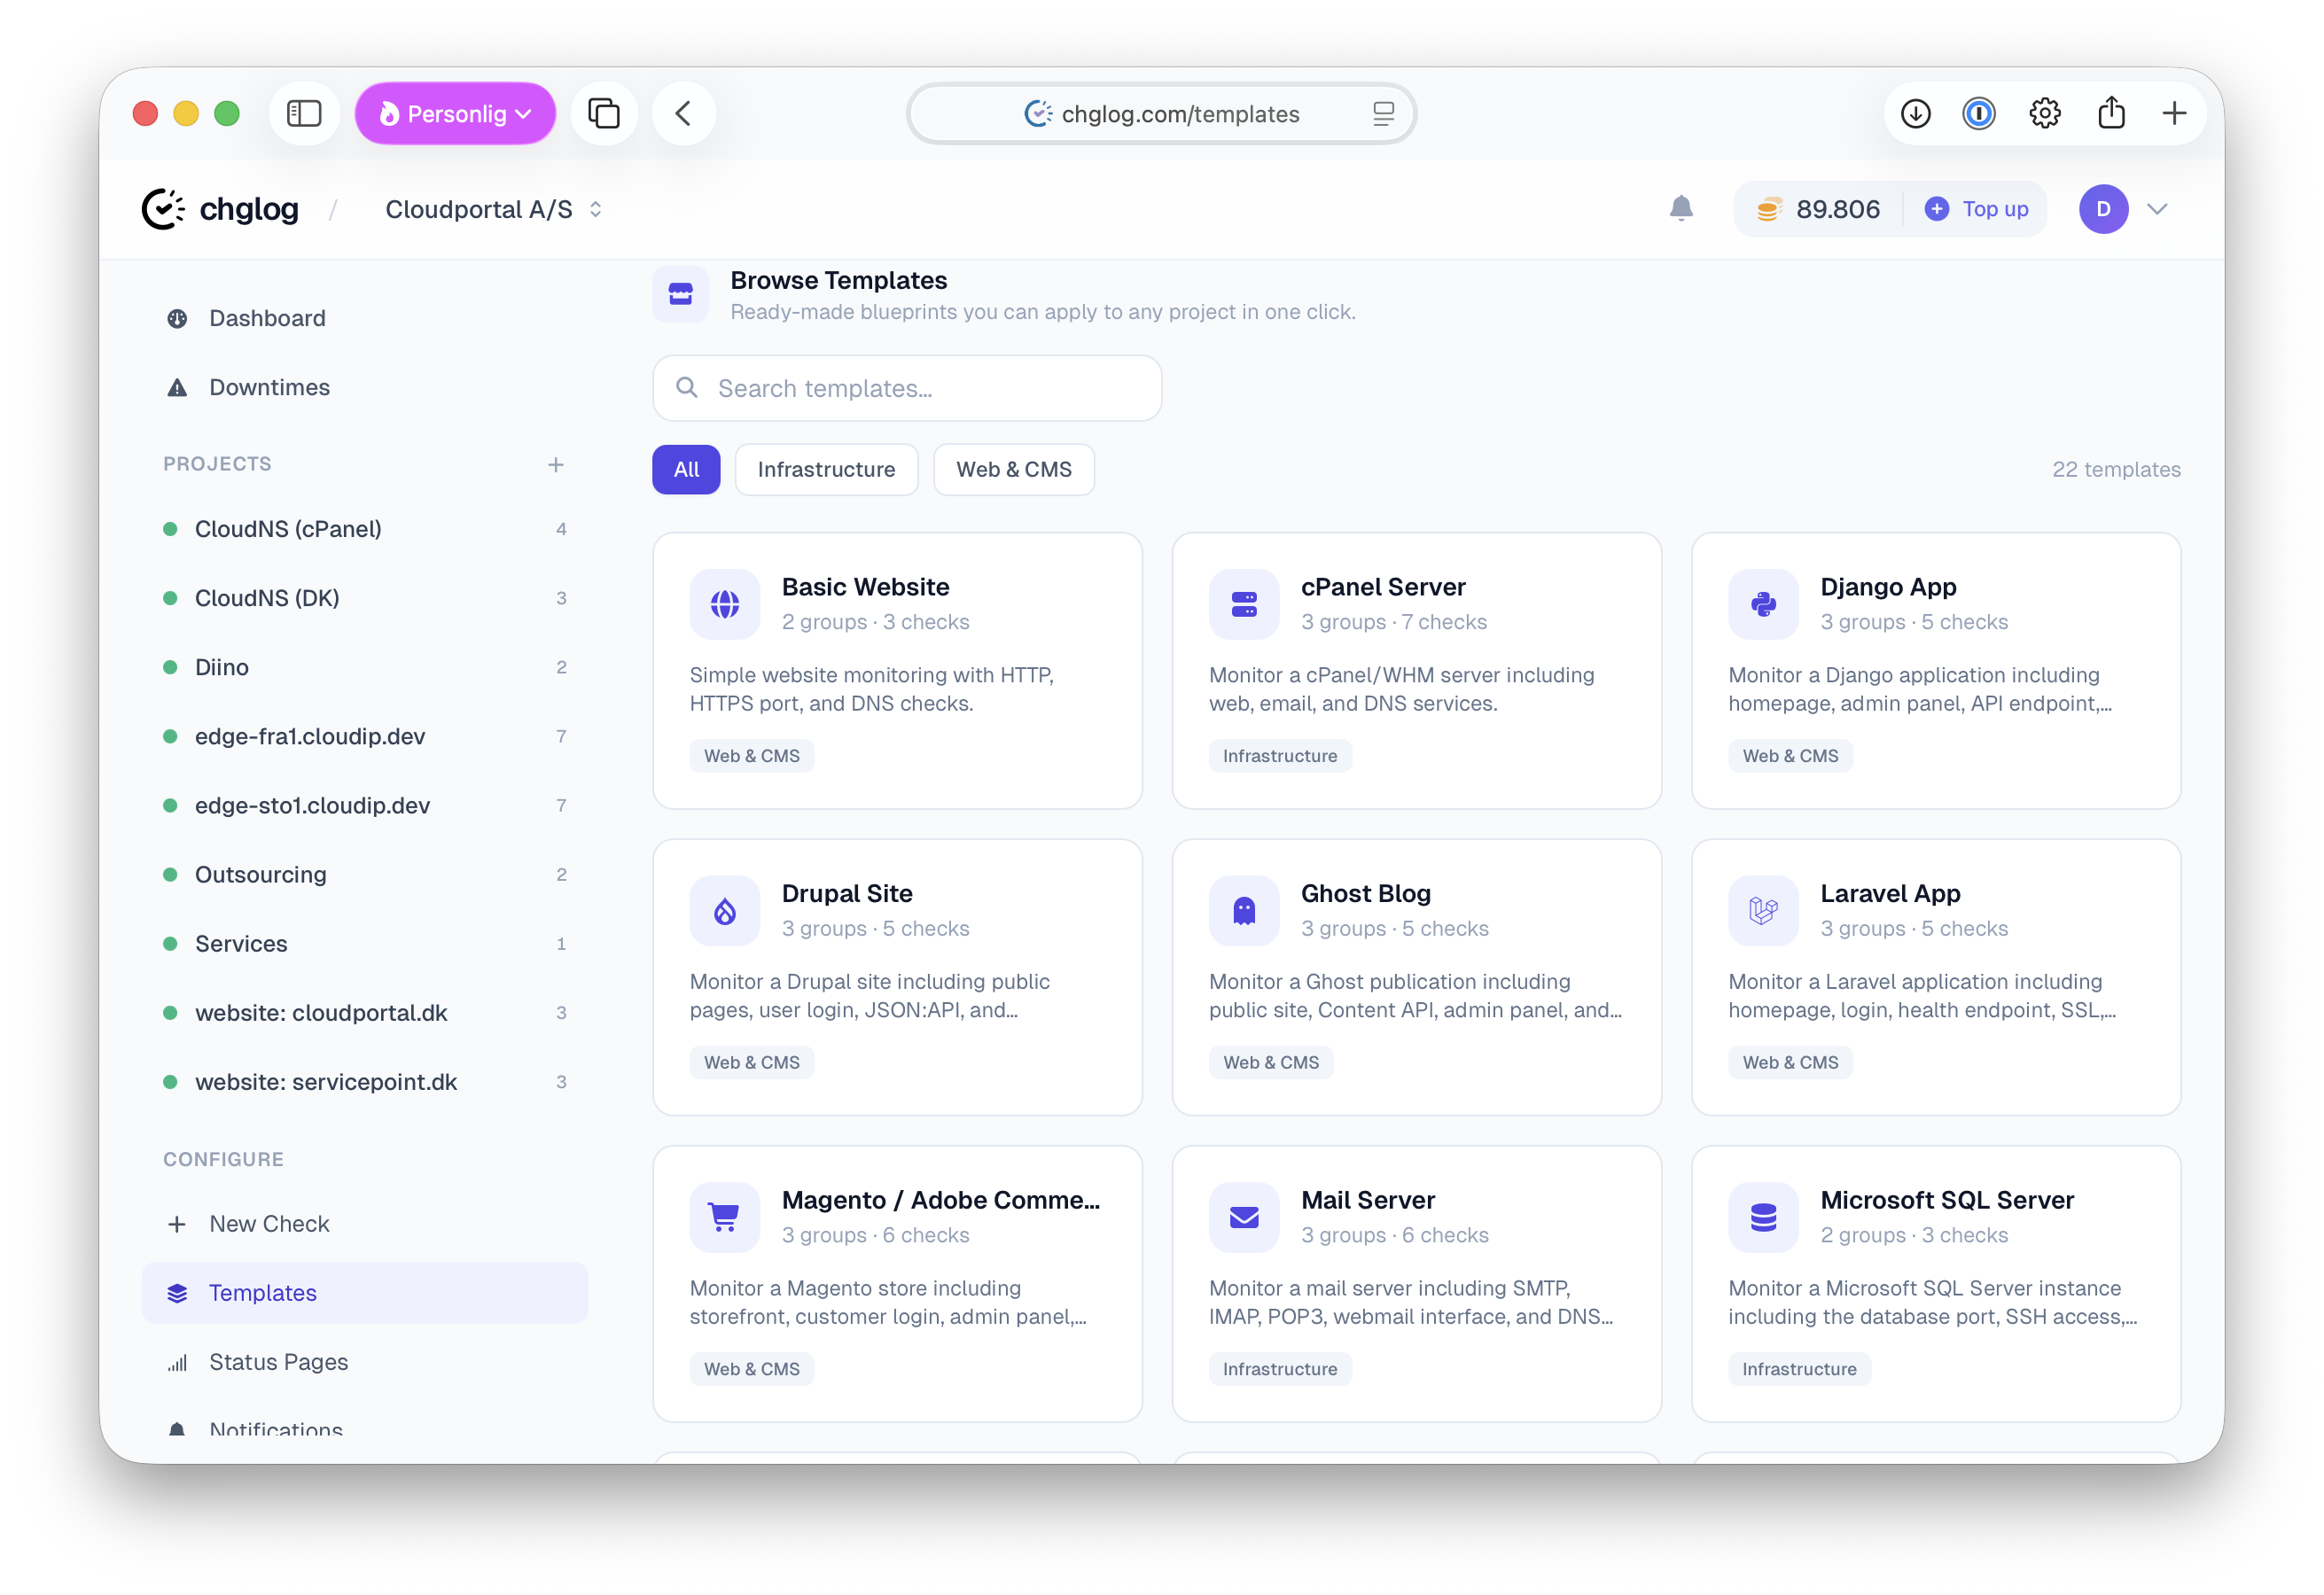
Templates: Deploy Monitors in Seconds
Start with ready-made templates or build your own reusable monitoring configs with variables. Roll out monitoring across dozens of sites with a single click — perfect for agencies and teams managing multiple projects.
- Pre-made templates — Common setups for HTTP, API, SSL and more — ready to go
- Custom templates with variables — Define
{{domain}},{{port}}and reuse across projects - Bulk deploy — Apply a template to multiple targets at once
- Share with your team — Templates are available to all team members
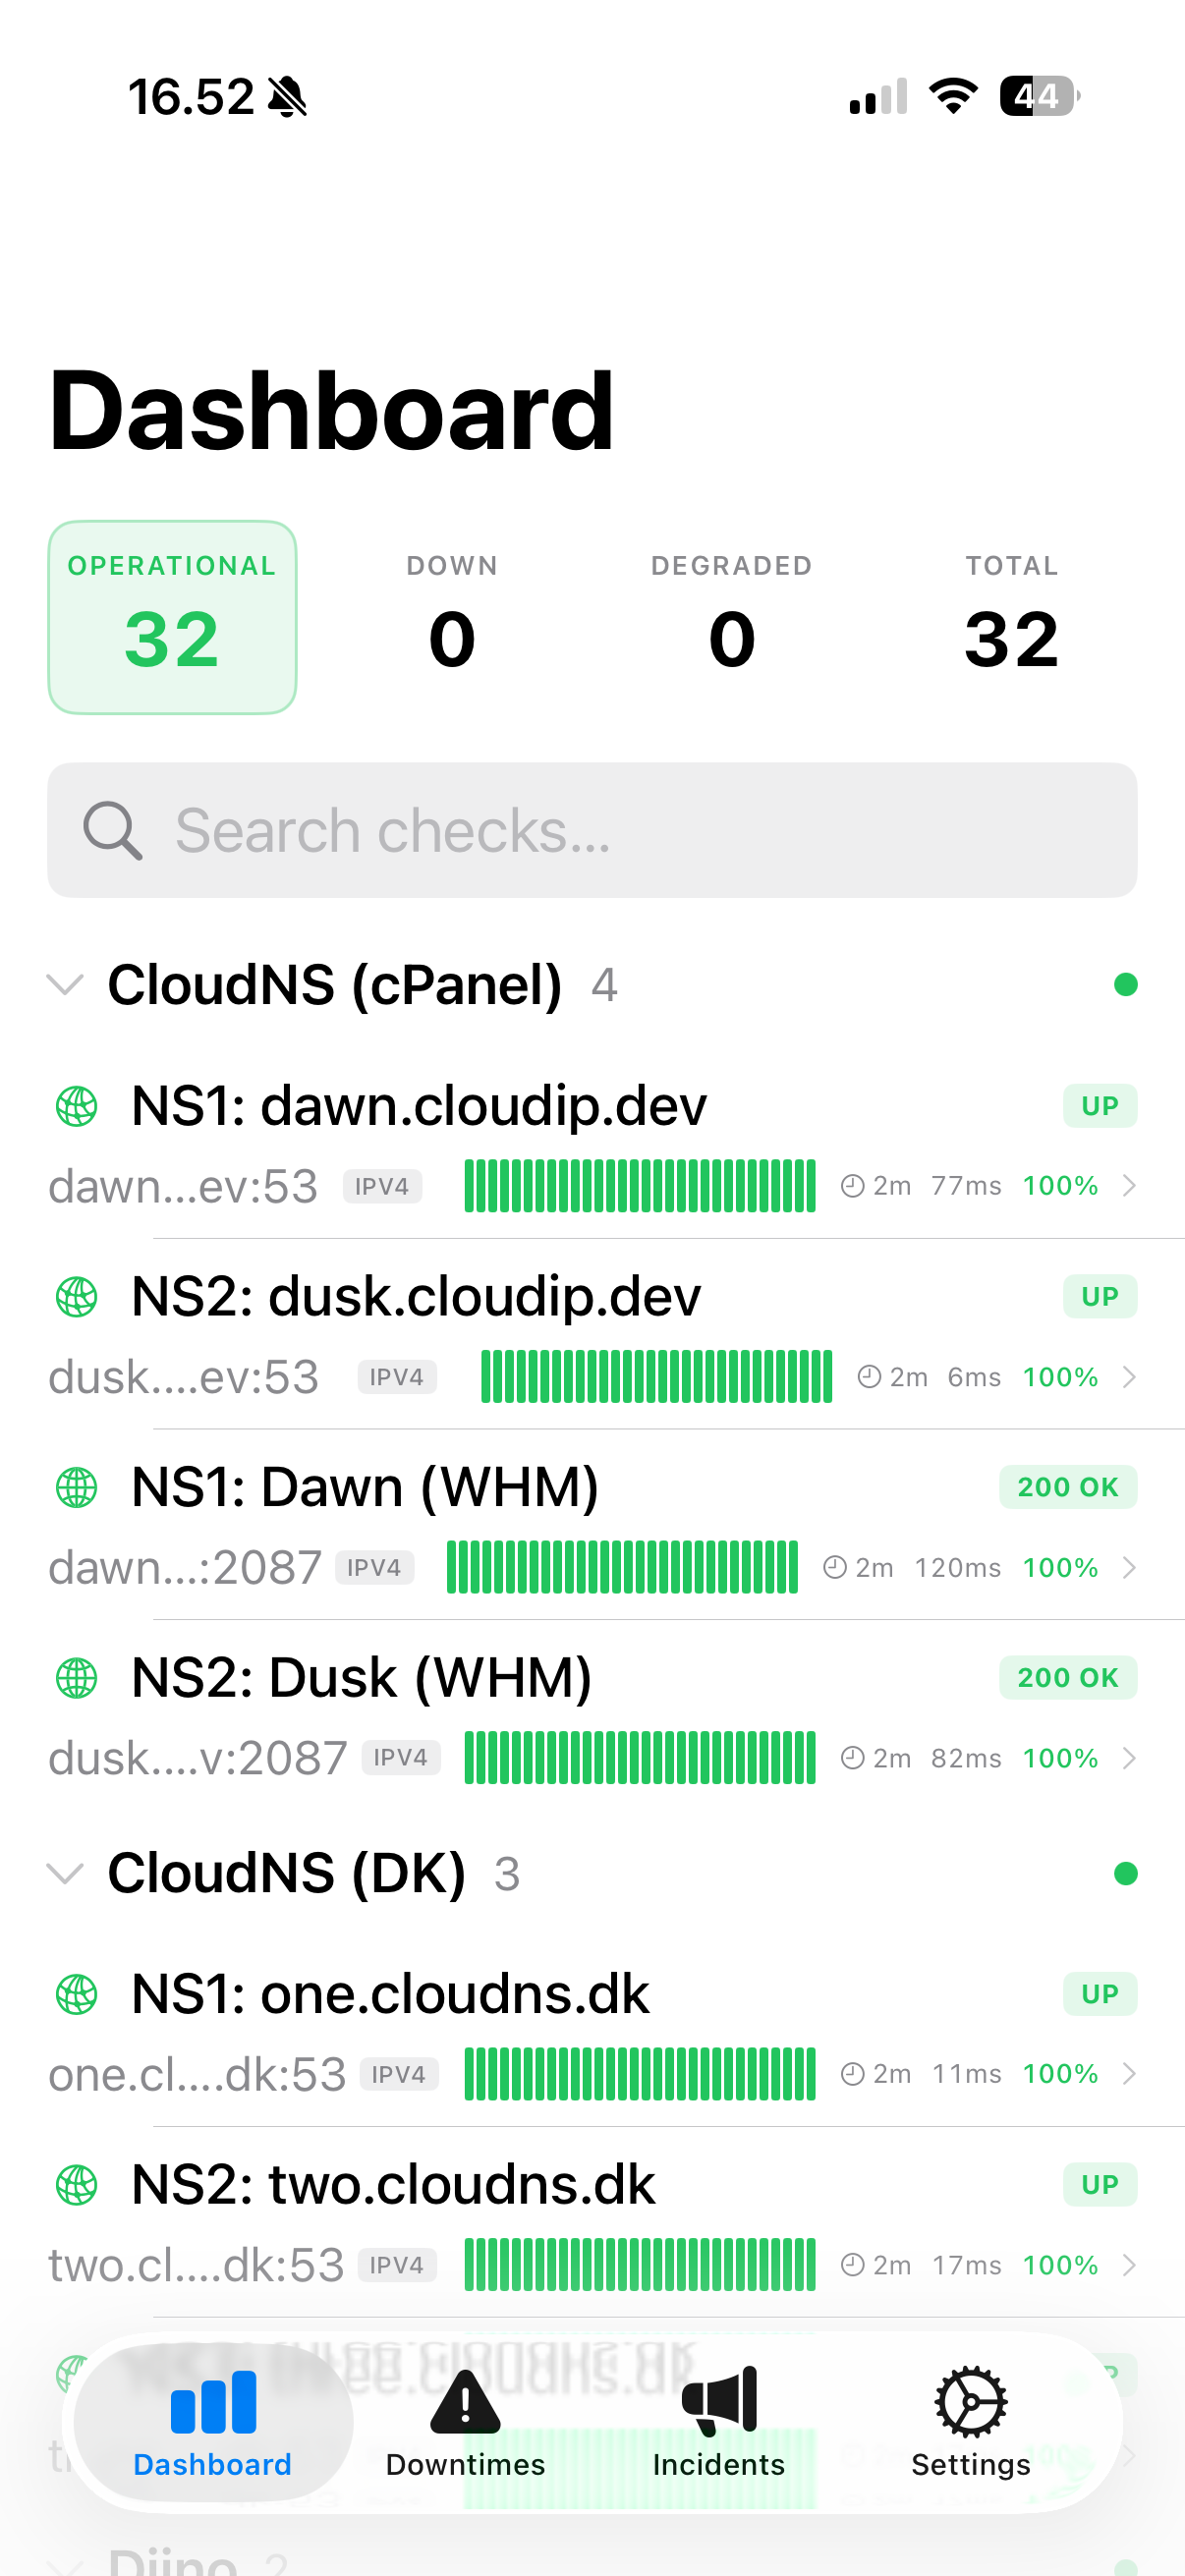
Native iOS App — Monitor on the Go
Real-time push notifications, check overview, and incident management right from your pocket. Currently in private beta with select teams — launching to everyone in May 2026.
- Native push notifications — Instant alerts straight to your lock screen
- Full dashboard access — View checks, uptime history, and response times
- Incident management — Acknowledge and resolve incidents from anywhere
- Team support — Switch between teams and projects on the go
Get Alerted Where You Already Work
Every notification channel is included for free. No limits, no paid upgrades.
Start Monitoring in 30 Seconds
100,000 free credits. No credit card. All features included from day one.